The Price is Not Right… (But Not by Much) December 22, 2008
Posted by DustinRJay in supply and demand.Tags: Calgary real estate, demand, supply
15 comments
In 2005 and 2006 supply was much less than demand and house prices rose. A ratio of 50% sales to new listings ratio has historically kept prices in balance. House prices overshot the supply/demand balance and started to fall. The crossover of the supply/demand balance indicates a level of price support at ~$375,000. Demand is likely to rebound slowly as prices drop. Supply is likely to retrace the supply/price relationship. As illustrated below, some overshoot to the downside is likely to burn through the current inventory.
Of particular interest is that supply had a high degree of elasticity in respect to price whereas sales did not. As a corollorary, I think that to some extent:
- Supply = f(marginal cost of supply), linear relationship
- Demand = f(consumer confidence), nonlinear relationship

Click above image to enlarge.
The 2008 Stock Market Crash – Irrational Despondence? October 9, 2008
Posted by DustinRJay in Calgary real estate.Tags: Calgary real estate, geometric series, investing, long term trends, stock market crash
12 comments
Since the S&P 500 peaked in 2007, the stock market has plummeted a whopping 42% from the peak. The dot-com bubble deflated over several years, whereas the United States housing bubble has collapsed over a much shorter time period and has brought down with it the American banking system. Fear has run amuck, and the question is, has rational thought regarding value given way to irrational fears regarding market risks?
If one believes that the market is a somewhat random geometric series of cash flows that resembles exponential growth, then one should be able to identify peaks and troughs in the market by defining an “upper peak” and “lower trough” line.
The recent bear stock market has easily broken through the previous “lower trough” line and therefore savvy investors may now find substantial value in good stocks that have solid balance sheets and dividends that pay above safe investments like bonds. The following graph shows the S&P 500 and the upper and lower trading bands:

How does this relate to Calgary real estate? Bear markets such as the 1987 stock market crash did not have an impact on Calgary real estate prices and there has been virtually no correlation between Calgary real estate prices and the S&P 500.
There is likely a stronger linkage between the S&P/TSX Capped Energy Index and Calgary real estate prices. Overall, the slumping stock prices in this sector will likely result in less money available for capital expenditures, and less shareholders cashing out. In turn, this may result in less demand for high end real estate in Calgary over the next 12 months.
I believe that in the energy sector in particular, one can find substantial value through scouring balance sheets for price to earnings ratios, price to book value ratios and dividend yields. The most recent CIBC World Markets Canadian Portfolio Strategy Outlook makes the argument that TSX stocks are at the cheapest since 1987, and furthermore that energy stocks will provide the most upside over the next year.
Full Disclosure: I have positions in Calgary real estate and corporations that are components of the S&P/TSX Capped Energy Index
Futures Market Predicting Troubled Assets Relief Act Passed Quickly September 24, 2008
Posted by DustinRJay in Uncategorized.Tags: futures market
11 comments
The Intrade futures market is currently predicting that there is 73% chance of approval for $700 billion US government bailout (Troubled Assets Relief Act) being approved before the end of the September. Passage of this act will help to reduce risk spreads and LIBOR rates and is seen as essential to preventing systemic risk to the American financial system. In addition, passage of this plan should make it easier for American banks to lend and mitigate damage to the US housing market. Most analysts expect this bill to be approved quickly barring any political interference.

Calgary Misery Index – A Reason For Optimism in The Housing Market September 23, 2008
Posted by DustinRJay in Calgary real estate, inflation.Tags: Calgary real estate, inflation, misery index, unemployment
13 comments
The misery index is a commonly used as a metric for stagflation. Stagflation is a combination of high unemployment and high inflation. High inflation and low unemployment rates created sharply rising house prices in the Calgary real estate market during the period from 1973 – 1983. In 1983, rapidly rising unemployment caused inflation levels to cool significantly, and house prices to fall. Again in 1990, upward trending unemployment rates caused house prices to stay flat for roughly 8 years.
In general, the following conditions are supportive of real estate growth:
- Low unemployment
- High Inflation
Today, we have near record low levels of unemployment (3.6%) and relatively high inflation (4.3%) and therefore provides two reasons for conservative optimism in the Calgary real estate market.
The following graph illustrates the relationship between inflation and unemployment to house prices:

Data Sources: CREB, Bob Truman – First Place Realty, Statistics Canada – Calgary Inflation, Alberta Unemployment Rate
“For a Mature Audience Only” – Benjamin Tal on the U.S. and Canadian Housing Market August 30, 2008
Posted by DustinRJay in Calgary real estate.Tags: Benjamin Tal, CIBC world markets, economist
9 comments
Real Estate Economics and Budgeting August 28, 2008
Posted by DustinRJay in Calgary real estate, valuation models.Tags: budget, Calgary real estate, economics, investing
4 comments
I think having a budget that you are comfortable with is critical to any investment strategy. By laying out the cash flows, and expected asset values you can get a feel for various economic parameters such as:
- Net present value comparison of various strategies
- Rate of return
- Sensitivity to various economic parameters such as interest rates and inflation
- Affordability or liquidity risks
I put together a budget of various shelter scenarios:
- Renting
- Renting and Investing the Difference
- Buying
- Investing
I hope you find this budget useful as I believe having a well laid out plan is extremely important. Having a solid budget in place will create long term value for investors and create a successful financial environment for your family.
I strongly encourage people to come up with their own budgets, and perform due diligence before making any investment decision.
The budget excel spreadsheets that I came up with are here:
( Budget – Office 2000 version \ Budget -Office 2007 version )
The Long View August 25, 2008
Posted by DustinRJay in Uncategorized.Tags: appreciation, Calgary real estate, housing cycle, inflation
13 comments
The following graph shows the average house prices from 1973 to current. For most of the graphs on this blog it has shown Calgary real estate from an inflation adjusted perspective. If one was to consider inflation however, it can be seen that buying real estate can be helpful as a hedge against inflation.
There are better times to buy than others, however I believe that for the average person that bought at the peak in 1983 or 1990 with a 25 year horizon that they are still probably very happy with their decision.
What do you think?

Data Source: CREB, Bob Truman – First Place Realty
A Tale of Two Markets August 23, 2008
Posted by DustinRJay in Calgary real estate, supply and demand.Tags: Calgary real estate, inventory overhang, MFH, overbuilding, SFH
3 comments
A split has occurred in regards to the single family home and multi family home construction environment. The following article address the differences in supply-side characteristics for each market.
Calgary single family home market:
- Correction in starts largely historical, capacity to overbuild looks minimal, last couple data points may point to a bottom approaching as housing construction returns to historical rates, orderly unwinding likely
Calgary multi family home market:
- Construction has continued unabated, capacity to overbuild in place, projects such as Gateway Midtown being suspended point to major trouble signs ahead, long way to drop for construction starts to return to historical rates, disorderly unwinding possible

Ye Olde Real Estate Vintage August 19, 2008
Posted by DustinRJay in Calgary real estate.Tags: Calgary real estate, Vintaging
2 comments
Bob Truman, at First Place Realty, is one of the sole providers of real estate information and statistics in Calgary besides the CREB. I use a lot of Bob’s data in my graphs, so he deserves a big shout-out for making this information available to the public!
He recently posted the Truman Index for same sales pairs in Calgary. This is similar to the Case-Shiller Index which uses the repeat sales technique to evaluate the housing market.
The following is a graph comparison of the change in:
- Truman Index
- Average Price of SFH in Calgary
- Median Price of SFH in Calgary

Some of the primary points this graph makes are:
- Lots of spread in market value can create opportunities and risk as properties may be bought and resold for a gain or loss of +/- $80,000
- Value of a good REALTOR can add $40,000 of value per transaction, alternatively a poor REALTOR can cost you $40,000 of value per transaction
- Some flippers still appear to be making good money even in a market with high inventory
- Truman index seems to fit well with older vintage SFH average and median data but poorly with more recent sales. This may be due to changes in real estate market mix, recent profitable flippers skewing the trend or loss aversion.
- The majority of sales in 2006 and 2007 are still “in the black” as a total of 67% were resold at or greater than the previous sale price.
- A good deal on a purchase and sale may be worth the same value as perfectly timing the market
- Pulling the title and using a vintaging methodology can be another tool for assessing value
Note:
- Same sales pair data was from sales during the period August 1 – 14, 2008
- I apologize in advance for the “busy” graph.
Greenomics and the Value of Living Close to Work August 17, 2008
Posted by DustinRJay in Calgary real estate, commute.Tags: Calgary real estate, carbon footprint, commute, gentrification
11 comments
I perceive a lot of value in living in downtown Calgary. I love the quick access to Flames games at the Saddledome, downtown nightlife, shopping on 17th Avenue, and jogging along the river pathways. Since recently moving, I have found myself walking to work and my vehicle has sat parked, except for weekend hikes.
My commute time is much shorter and my transportation costs have dropped dramatically. For those that are considering living in the inner city vs. the suburbs I came up with an estimate of the value placed on living in close proximity to your workplace.
I considered various factors that would change if one eliminated the use of one vehicle in their household as a result of living downtown. These include:
- Fuel costs
- Vehicle replacement costs
- Insurance costs
- Maintenance costs
- Parking costs
- Value one places on a shorter commute time
- Carbon footprint
The value I place simply on living close to work over the course of 25 years is about $250,000 at a discount rate of 7%. Also, it would result in having an extra 163 days of life not stuck in traffic over 25 years. Furthermore, over the span of 25 years, my carbon footprint would be reduced by 76,700 kgs. ¡Qué bueno!
By doing this exercise I also found that fuel costs are relatively small in comparison to the other costs associated with owning a vehicle. I believe that fuel costs are still much too small to encourage large fuel-efficiency improvements.
You can access the spreadsheet here and tailor it to your unique situation:
Things that go BOOM! August 9, 2008
Posted by DustinRJay in Calgary real estate, stock market.Tags: Calgary real estate, energy, stock market
8 comments
The S&P/TSX Capped Energy Index is formed primarily of companies that have headquarters in Calgary. Since 2001, the index has quadrupled creating wealth on a massive scale. The boom in commodity prices has resulted in energy companies making more money, spending more money and allowing vested shareholders to cash out.
Excess liquidity brought about by the strong financial performance of Calgary energy companies was likely a major contributor to the Calgary house price boom.
The following graph shows that:
- S&P/TSX Capped Energy Index outperformed Calgary real estate as an investment
- Performance of the S&P/TSX Capped Energy Index was likely a leading indicator of the real estate boom

Volatility in Housing Markets (Part 2 of 2) July 27, 2008
Posted by DustinRJay in Uncategorized.15 comments
This is a follow-up to my previous post about volatility in the housing market. For those that are looking to buy or sell a house, you may want to research what the worst and best annual scenario may look like.
The results and graph using the same data set as my previous post are below:
- P90: -5.6% (90% chance of price growth being greater than -5.6%)
- P50: +5.9% (50% chance of price growth being greater than +5.9%)
- P10: +19.9% (10% chance of price growth being greater than +19.9%)

Inflationary effects like rising household income and rent increases will continue and house prices will continue to have softness as long as there is high inventory. I believe this will entail a soft landing for the Calgary real estate market with the market chugging along between P90 and P50 for between 2-7 years.
Volatility in Housing Markets (Part 1 of 2) July 20, 2008
Posted by DustinRJay in Calgary real estate, volatility.Tags: Calgary real estate, volatility
5 comments
In general, housing prices have a low volatility compared to other asset classes. This is due to the underlying fundamental value (rents) being a relatively stable cash flow. This compares against stocks which have larger variance in earnings and therefore larger volatility in price.
A lookback at historical real estate volatility can help to give a forecast probability cloud. By comparison, the S&P 500 has a VIX index which is representative of S&P 500 volatility over the next 30 day period and is referred to by some as the fear index.
A quarterly calculation of year over year price changes by histogram for Calgary real estate from Q3 1977 to Q1 2008 helps identify the scale of price changes that could occur in one year. The results are below:
- P90: -5.6% (90% chance of price growth being greater than -5.6%)
- P50: +5.9% (50% chance of price growth being greater than +5.9%)
- P10: +19.9% (10% chance of price growth being greater than +19.9%)
Furthermore, the probability of an event occurring that is above the P10 or below the P90 for 5 consecutive years is 1 in 100,000 for each (i.e.: (1/10)^5 = 1/100,000). The shortfall of this kind of approach to volatility is that this calculation is not statistically independent as bear and bull markets typically last between 2-10 years.
What this analysis demonstrates is that even if a bearish scenario is the right approach, Mr. Market could take a very long time to unwind. The following graph illustrates what 5 consecutive P10, P50 and P90 events would look like and is meant to represent the best case, best guess and worst case respectively.

Click, Whirr – Betting the Shortcut July 15, 2008
Posted by DustinRJay in Calgary real estate, market behaviour.Tags: Alberta REIN, bank run, crowd psychology
6 comments
The failure in the US housing market was not a black swan as some have described it, but an error in understanding and managing collective risks.
Some of the psychological phenomena that may have contributed to the housing boom and bust are explored in a book called “Influence – The Psychology of Persuasion.” Some of these are:
1. Social Proof – Truths are Us
- Banks rely on other banks to determine risk management practices and safe lending procedures
- Real estate investment organizations like Alberta REIN have a bandwagon effect or crowd psychology (see photos here)
2. Authority – Directed Deference
- Appeal to authority of a “REALTOR®” (don’t forget the caps lock!)
3. Scarcity – The Rule of the Few
- Appeal to buy due to lack of supply (low housing inventory in Calgary 2006 to mid 2007)
4. Commitment and Consistency – Hobgoblins of the Mind
- The real estate market has only gone upwards for the past 10 years and therefore is perceived as having no risk
And on that note, I’ll leave you with a YouTube video of last weeks bank run on Indymac as a demonstration of crowd psychology. Enjoy!
Calgary Real Estate Price Elasticity of Supply June 16, 2008
Posted by DustinRJay in Calgary real estate, supply and demand.Tags: Calgary real estate, supply and demand
12 comments
The supply of residential construction in Calgary has been tightly correlated with house prices over the past 30+ years. High house prices lead to high levels of residential construction as increased margins encourage more market participants.
The following graph compares the amount of units under construction to house prices:

I believe this graph demonstrates that the Calgary real estate market is capable of oversupplying the market at the current price point and will continue to do so until developers margins are thinner. Feel free to post your own interpretation below.
Condo Crazy June 2, 2008
Posted by DustinRJay in Calgary real estate, condos, supply and demand.Tags: Adora, Akoya, Alberta Boots, Arriva, Assured on 14th, Astoria, Aura, Bluffs, Castello, Centuria on the Park, City Centre, Colours, Concord Pacific Calgary, CPA Lands II, Cristal, Destiny, Douglas Glen Condo Village, Eau Claire, Eden, Encore, Exchange, Five West, Gateway Beltline, Gateway Southcentre, Giffels at Stampede Station, Grand Haras, Grand Royal, Grosvenor on 15th, Grosvenor on 5th, Habitat for Humanity, Highbury, Horizon Housing Society, Hotel Arts East, International House, Kahanoff Expansion, Kai Towers, Keynote, LaCaille on 4th, LaCaille on 8th, Lake Placid Eau Claire, LaRive, Le Germain, London at Heritage, Luna, Marda Loop Mixed Use, Midtown Towers, Mission Crossing, Mode, Montana, National Condos, Nova, Nuera, Oscar, Ovation, Quarry Park, Ramsay Exchange, Renoir Suites, Riverfront Pointe, Riverside Quays, Skytower, The Crossings, The Seed, Triangle Lands, Tweed, Union Square, Varsity Landing, Verana, Vetro, Viva, Vox, WAM Chinook, Waterfront, Xenex
20 comments
There are massive levels of new construction about to hit the condo market. There are a record 3,000+ condo units for sale in the resale market. This is relatively small in comparison to the whopping 20,000+ multi-family residential units that are in construction, approved or proposed for Calgary.
The following mosaic and slideshow was compiled based on condo construction due for Calgary.
Hat tip to Boris2K7 for providing detailed information on the Calgary Construction Forum.

Calgary Housing Market Looking Gluttonous – Fight That Flab! May 31, 2008
Posted by DustinRJay in Calgary real estate, residential construction.Tags: Calgary real estate, residential construction
10 comments
A comparison of units under construction in Calgary against population growth can help identify if there is too much residential real estate being developed. The following graph yields some interesting conclusions:

- Residential units under construction in Calgary is at unprecedented levels, easily surpassing the residential construction rate during the early 1980’s boom.
- There are record levels of inventory in the resale market with over 13,000 units for sale in the Calgary and surrounding area. This is coupled with yet another 14,000 units under construction and due to come on the market shortly. This should be very worrying for developers. Total residential units under construction would likely need to correct by more than 30% or to roughly pre-2006 construction levels to stabilize the supply/demand balance. If inventory continues to build and starts do not drop off than the correction will become more severe.
- In general: as housing starts increase, house prices go up. As housing starts decrease, house prices go down. This graph shows a recent American example.
- The fact that housing construction has increased relative to population growth is an indicator of a developing supply glut. Residential construction should have a trendline roughly parallel to population growth.
- Alberta has one of the highest costs of living and some of the poorest housing affordability in the country so it is unclear how population growth can continue at recent high growth rates. Recent Statistics Canada information has shown Alberta as having negative interprovincial migration.
- Housing production rates are firmly coupled to house prices. The number of residential units under construction has tripled since 2000.
- There is a better correlation between house prices and units under construction than population growth and units under construction.
- High carrying costs caused by a combination of high prices and higher interest rates was the primary cause of the 1980’s real estate crash. It resulted in a foreclosure boom and housing construction levels were decimated in only 2 years.
Credit Junky Nightmare – Credit Cycles Effect on Housing Market (Part 3 of 3) May 15, 2008
Posted by DustinRJay in Calgary real estate, mortgages, Uncategorized.Tags: Calgary real estate, mortgage arrears
11 comments
The cyclical average for mortgage arrears in Alberta has been about 0.4%. As affordability in Alberta is the poorest since the previous real estate peak in 1990, one would expect mortgage arrears to increase to closer to the cyclical average (or more). The current low rate of mortgage arrears is reflective of the fact that as house prices rapidly increase, people have more options available such as selling or refinancing.
As time passes, and more people have purchased properties that they can marginally afford and/or poorer economic conditions develops, the amount of mortgages arrears will increase. Credit risk typically appears after house prices have stagnated or begun to fall.
The following graph shows that Alberta mortgage arrears have only recently begun to increase:
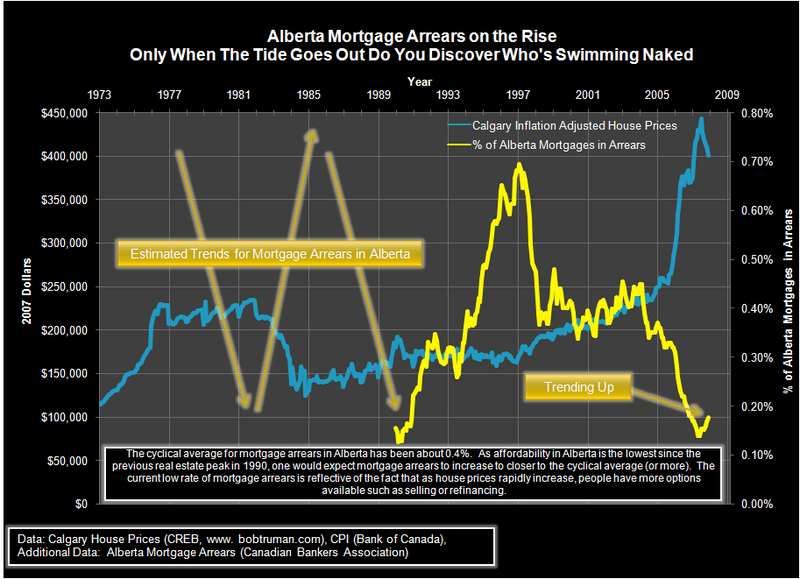
I would highly recommend to compare this graph with Mohican’s at Langley Financial Planning and Personal Sanity who originally posted a similar mortgage arrears analysis for British Columbia.
As for timing real estate transactions, it is good investment advice to be, “fearful when others are greedy, and be greedy when others are fearful.” Look to mortgage arrears for help in timing peaks and troughs, as high amounts of mortgage arrears can indicate a good time to buy, whereas low amounts of mortgage arrears can indicate a good time to sell.
More specifically, trend direction changes in mortgage arrears from cyclical highs or lows can indicate an inflection point in the real estate cycle.
Credit Junky Nightmare – Credit Cycles Effect on Housing Market (Part 2 of 3) May 14, 2008
Posted by DustinRJay in Calgary real estate, mortgages, supply and demand.Tags: Calgary real estate, credit markets
5 comments
Changing credit conditions impacts the demand for real estate. If credit lending practices are loosened, it allows new participants to purchase real estate. The increased demand for real estate creates upward price pressure until the demand can be satiated.
Likewise, if credit lending practices are tightened, less participants can purchase real estate which reduces demand for real estate.
So how have credit conditions in Canada changed over the past couple years?
The following is a timeline of roll-outs of new CMHC products which demonstrates the rapid loosening of credit that occurred in 2006 through mid 2007:
- February 2006: CMHC to insure 30 year mortgages on a pilot basis
- June 2006: CMHC introduces 35 year mortgage and interest-only mortgage insurance
- December 2006: CMHC introduces insurance for 40 year mortgages
- September 2007: CMHC offers insurance for 100% financed investment properties
Recently, due to the turmoil in credit markets, the amount of subprime mortgages funded in Canada has dropped substantially. As an example, Xceed’s (Canadian subprime lender) funded mortgages have plummeted from $340.0 million to $65.7 million. This one lender has resulted in a quarter billion less financing for real estate in Canada over the same reporting period last year. Tightened lending standards helps explain why YoY sales volumes are down considerably.
In summary, credit conditions affect the demand for real estate, so it is prudent to pay attention to how it impacts the supply/demand balance.
Credit Junky Nightmare – Credit Cycles Effect on Housing Market (Part 1 of 3) March 25, 2008
Posted by DustinRJay in Calgary real estate, mortgages, risk spreads, supply and demand.Tags: Calgary real estate, credit cycle
16 comments
When house prices are increasing, if a homeowner’s mortgage is delinquent they have the option to sell and preserve their credit rating. However, in a falling real estate market, the homeowner will often end up foreclosing due to lack of an option. Therefore credit risk typically only appears when house prices are falling.
Credit has become easier in Canada over the past few years and that has affected the supply/demand balance. The following three posts will cover some aspects of how the credit markets are changing and how risk to the mortgage markets only appears after house prices have started falling.
This rudimentary diagram shows how the credit cycle has positive feedback during the upward cycle:

And this diagram helps describe how the credit cycle unwinds:

Game Over for First Time Home Buyer? March 18, 2008
Posted by DustinRJay in Calgary real estate, supply and demand.Tags: Calgary real estate, demand, first time home buyer, inventory, sales, supply
20 comments
Single family home sales have dropped off dramatically in Calgary year over year. Therefore, it’s difficult to determine if averages and medians are representative of the direction of the market or reflective of changes in composition of the sales mix.
The following graph illustrates the year over year change in sales volume by price range:

It illustrates that:
-
For the first time home buyer market, single family home sales volumes have experienced significant deterioration
-
Higher-end ($600,000+) single family home sales volumes have held steady
As an aside, things in naturally occurring populations typically lie in a log normal distribution (including distribution of reserves in oilfields). Hence, it comes as no suprise that things like household income and also house prices also lie in a log normal distribution.
ArriVa – No One Home? March 12, 2008
Posted by DustinRJay in Calgary real estate, condos.Tags: Arriva, Calgary real estate, condos, speculation
24 comments
ArriVa is one of the most recent condo’s that have finished construction in downtown Calgary. Construction has finished a couple of months ago and there are currently 22 units in the building that have been listed by speculators for a total of $15 million as shown by the picture below. A review of other condo’s in the downtown Calgary region shows that there is similar amounts of speculative activity with many individuals having no interest in holding the property long term.

Calgary condo inventory has hit all-time record amounts and there are currently 2519 condo units for sale in Calgary. In addition, condo inventory is rapidly growing due to near record amounts of multi-family home construction in Calgary.
With Calgary condo inventory roughly triple last year, sales down 37% year over year for February, and listings up 40% year over year for February, I find it likely that many of these speculators will be unsuccessful with flipping there property and some will end up in foreclosure.
Credit: Original photo by Lumin8 on Flickr
Calgary’s Official Bird the Tower Crane Returns – Highly Cyclical Migration Pattern March 10, 2008
Posted by DustinRJay in Calgary real estate.Tags: boom, bust, Calgary real estate, commercial real estate, construction
7 comments
The amount of commercial real estate being developed in Calgary has not been witnessed since the 70’s and early 80’s. There are currently several mega-projects being built including the Bow (236.0 m), Eighth Avenue Place I (213.2 m), Centennial Place I (176.0 m), Jamieson Place (170.0 m), and Centennial Place II (110.0 m). These commercial buildings will greatly increase the amount of square footage of commercial real estate available downtown.
The Bow, at a staggering 1.7 million square feet, will consolidate EnCana’s staff from three buildings into one. Eighth Avenue Place (Penny Lane) currently has no anchor tenant and is being built on speculation. Commercial real estate lease agents are currently having a hard time getting anyone to sign a 1+ year contract due to the volumes of commercial real estate being developed.
It is possible that there is going to be an oversupply of commercial real estate in Calgary, and after this wave of commercial real estate is finished, there will likely be an extended lull in construction.
The following graph compares aggregate height of commercial buildings constructed over 100 metres by completion year against residential real estate prices:

A timeline of images of Calgary skylines shows that there is little change in commercial development from 1985 to 2004.
Some of the conclusions I came up with after doing this analysis are fairly intuitive, but help to provide insight into timing. These are:
- Residential prices boom during periods of commercial construction booms.
- Current commercial construction levels have not been this high since the 70’s and early 80’s.
- The residential real estate bust in Calgary occurred during a time when there was record levels of large scale commercial real estate construction being completed.
- When the 1980’s commercial construction boom ended, house values fell dramatically.
- Overdevelopment of commercial real estate in the 80’s left little constructed for the following 20 years.
- Commercial real estate construction is incredibly cyclical.
- For this construction boom, there is a much greater share of construction projects over 100 metres that are residential vs. commercial.
As an aside, I encourage anyone who is looking at the Canadian real estate market to look past the sound bites. Due to their vested interest, it is difficult to find a banker, real estate agent, CMHC analyst, developer, newspaper, or radio program which has the chance to be frank and analytical.
A Comparison of Calgary House Prices to the US Real Estate Market February 27, 2008
Posted by DustinRJay in Calgary real estate, US real estate.Tags: Calgary real estate market, US real estate market
30 comments
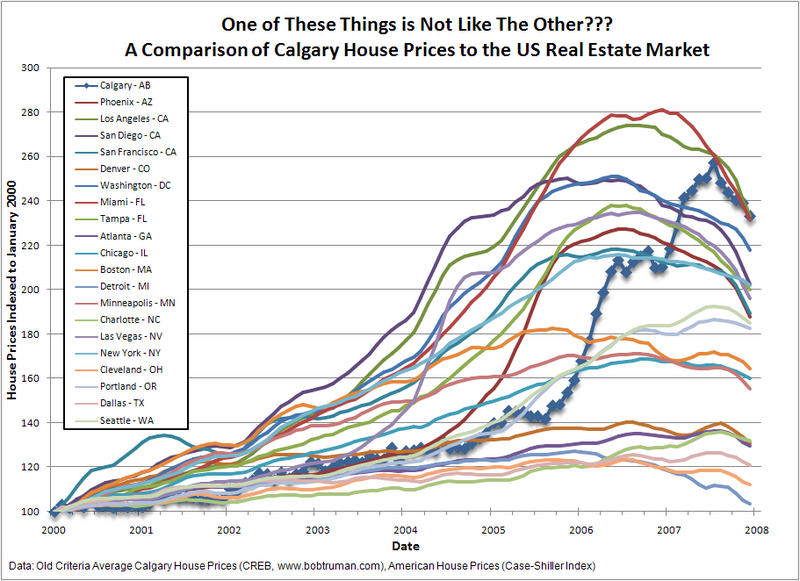
A couple of conclusions can be reached by examining Calgary real estate prices to the US real estate market:
-
The Calgary real estate boom occurred 1 to 2 years after the US boom
-
Calgary house prices have increased by more than most American cities
-
The precipitous drop in Calgary real estate in late 2007 is comparable to some of the most overheated markets in the US
-
American cities that had ‘sharp’ appreciation are now experiencing ‘sharp’ depreciation
A graph of Calgary and American real estate prices is below:
Long Term Relationship Between Calgary House Prices and Alberta Economic Activity Diverge – Irrational Exuberance? February 24, 2008
Posted by DustinRJay in Calgary real estate, long term real estate trends.Tags: Alberta, calgary house prices, GDP per capita
12 comments
The price of houses is linked to the economic well-being of the region. Recently, the Alberta economy has been extremely strong and Calgary house prices have increased tremendously. But the question remains, did house prices increase rationally in comparison to economic growth?
A comparison of house prices and GDP per capita show that they roughly track each other for 24 years and then sharply diverge. This could imply that recent asset valuations of houses have been irrationally exuberant, and a more rational valuation of ~$300,000 would be approprate given the current level of economic acitivity.

Financial Calculators For Making Real Estate Investment Decisions February 13, 2008
Posted by DustinRJay in Calgary real estate, rental yields.Tags: Calgary real estate, capitalization rate, rent vs. buy, rent vs. sell, rental yield
2 comments
I have found the following two calculators useful for making decisions regarding whether or not it is a good time to buy or sell real estate. Some good test examples are:
- What is a fair market value for a house given its rent and an investment horizon of 10 years? e.g. No difference in wealth between renting and owning over a period of 10 years. What about 30 years? What about 5 years?
- How much does increasing or decreasing interest rates by 2 percentage points affect the economics of buying vs. renting?
- Develop three cases using conservative values, best guess values and upside values for owning vs. renting. How do they compare?
- Would a rental property have a greater return than safe investments like bonds or GIC’s?
The calculators are available at:
Risk Spreads – A Red Light on the Real Estate Market February 7, 2008
Posted by DustinRJay in Calgary real estate, risk spreads.Tags: bonds, Calgary real estate, Calgary real estate market, Canadian real estate, risk spreads, risks
4 comments
Typically, when looking for a good investment opportunity, one expects a higher return than a safe investment like a bond.
A mortgage product has risk and therefore should have a higher return than a bond. By an analysis of the spread above the safe investment vehichle one can determine periods of heightened risk in the credit markets.
Typically, heightened risk in the credit markets has accompanied recessions. Also, this has proved to be one of several warning indicators for the peak in the housing market cycle.
As you can see in the following graph, large jumps in the risk spread (red zone) have typically accompanied the start of a bear market in real estate. In addition, a recession has often followed a sharp increase in the risk spread. Currently, the risk spread is the highest it has been since the early 1980’s bear Calgary real estate market.
This sort of analysis is useful in identifying some of the creamier investing opportunities (green zone) when the risks have been smaller.

Reading Tea Leaves – Predicting Canadian Recessions Using Financial Variables February 5, 2008
Posted by DustinRJay in recession risks.Tags: bonds, commercial paper, recession, yield spreads
36 comments
One of the tools that the Bank of Canada uses for forecasting probability of recessions is the spread between Government of Canada 10 year bond yields and 90 day commercial paper. This is a leading indicator of slower economic growth. The benefit of using a tool like this, is that if recessions can be successfully predicted in advance, monetary policy can be adjusted accordingly.
The paper “Predicting Canadian Recessions Using Financial Variables: A Probit Approach” concludes to say:
“Results in the paper show that, in comparison to other financial variables, the spread between Canadian long bonds and the 90-day commercial paper rate is best at predicting recessions in Canada.”
The following graph shows that the spread has been the largest since the 1990’s recession for about a year:

The past two recessions have marked peaks in the housing cycle in Calgary. As carrying costs are the highest since previous housing bubbles (see this post), it is useful to estimate the probability of a recession as a tool in forecasting the peak in the current housing cycle.
I am optimistic that Canada will avoid a recession at this point. However, I estimate that the next period will be the slowest economic growth that has been seen in more than a decade. I estimate that the probabilities of a Canadian recession are about the chance of flipping a coin three times and having all heads. Currently, Global Insight has estimated the probability of recession at 25% in Canada, with most other instutions forecasting less risk than that.
For those that are highly leveraged and unable to cope with an economic shock, there may be difficult times ahead…
Calgary Real Estate Supply & Demand January 2008 February 2, 2008
Posted by DustinRJay in supply and demand.Tags: Calgary real estate, Calgary real estate forecast, CREB predictions, January 2008 housing statistics
11 comments
A review of supply and demand is important in understanding the direction of house prices. The following graph shows the recent trends of inventory and year over year sales. In summary, the market has changed dramatically from last year:
-
Current inventory is more than double January 2007
-
Sales are down more than 30% year over year

Please feel free to post your own interpretation.
Canadian REIT Firesale – No Decoupling From US Real Estate January 29, 2008
Posted by DustinRJay in stocks.Tags: Canadian real estate, decoupling, REIT, US real estate
8 comments
Both Canadian and American real estate investment trust indices have performed extremely poorly over the past three quarters. Canadian real estate investment trusts are down roughly 25% from peaks in early 2007. This is very similar to the performance of US real estate investment trusts. If investors expected Canadian real estate to outperform American real estate, the indices should have diverged.
The following graph is a comparison of Canadian vs. American real estate investment trust indices:

One possible reason for the repricing of Canadian REIT’s is that both Canadian and US real estate prices have roughly doubled since 1995 and this has raised the same concerns of overvaluation that are present in the US markets.
Carrying Costs for Calgary Houses – Highest Since the 1980’s January 27, 2008
Posted by DustinRJay in carrying costs.Tags: appreciation, boom, bust, calgary house prices, correction, crash, interest rates, rally
8 comments
One macroeconomic factor affecting real estate is interest rates. As interest rates go down, house prices should go up and vice versa.
Here is a summary of conclusions that I have made regarding the graph below:
-
Historical annual carrying costs above ~$17,500 in 2007 dollars appear to be unsustainable
-
Recessions often follow peaks in the housing cycle (as is currently being exhibited in the United States)
-
Upward trending house prices from 1997 to 2005 is rational due to decreasing interest rates
-
It is unlikely for there to be interest rate relief in the magnitude necessary to bring carrying costs into sustainable territory
-
Interest rates are still relatively low in a historic sense

Calgary Bull or Bear Real Estate Market? January 22, 2008
Posted by DustinRJay in short term real estate trends.Tags: bear market, bull market, Calgary real estate, forecast, prediction
10 comments
For those looking to buy or sell in the near term it is worthwhile to understand the current trend so that some forecasting or predictions can be made about the real estate market. This is a complementary post to my Long Term Trends in Calgary Real Estate.
The primary factor affecting the near term trends is the supply & demand balance. The absorption rate is the (current inventory)/(sales in the last 30 days).
For example, as of yesterday:
Active listings: 3882
Sales last 30 days: 777
Absorption Rate: 3882/777 = 5.00 months
CREB defines a balanced market as anywhere between 2.0 to 3.5. The following graph illustrates the relationship between the absorption rate and the price change per month.

If the absorption rate was:
Below 2.0 = 79% of the time there were price increases
Above 3.5 = 100% of the time there were price decreases
The equation that can be used to roughly predict the price increases or decreases per month is:
Price Change Per Month = -$4,594 * (Absorption Rate) +$14,141
Based on the current absorption rate of 5 months, it appears that price decreases in the near future are likely.
First Encounter with a Calgary Mortgage Broker January 20, 2008
Posted by DustinRJay in mortgages.Tags: Calgary mortgage brokers, mortgage broker, mortgages
12 comments
Buying a house is the biggest purchase that most people make in a life, and how you choose to finance it is a part of how you meet your personal and financial goals in life.
So, this weekend, I gave a local mortgage broker a call here in Calgary. I wanted to know what index variable rate mortgages were based on and how often it changed. Instead, he asked how much money I made and proceeded to give me a quote for the maximum mortgage I could afford with a 40 year mortgage. Not exactly what I asked for…
If anyone knows of reputable mortgage brokers in Calgary that have a focus on their client’s interests, or credible sources for mortgage information with a focus on financial planning, please feel free to post your recommendations below.
I have found the Canadian Mortgage Trends blog written by Melanie & Robert McLister to be extremely useful in keeping up to date on mortgage related news. Bearclaw also has a good blog about 40 year mortgages the other day.
My personal thoughts are that unless you have an income producing investment that has a greater rate of return than your mortgage rate, paying off your mortgage as quickly as possible is very good advice. By increasing the amortization period from 25 year to 40 years, the interest paid is about 75% more.
Rich Dad? Poor Dad? A New Territory for Calgary House Price to Household Income Ratios January 19, 2008
Posted by DustinRJay in house price to household income.Tags: Calgary real estate, house price to household income ratio, house prices
3 comments
I was interested in how Calgary house prices historically compared against household income. The two papers I am aware of that have been written in relation to the subject are:
-
RBC’s “Housing Affordability” concluded that “Affordability levels in Calgary are now comparable to levels reached in the late 1980’s at the peak of the housing market bubble and this has sparked some concern about the sustainability of prices… But caution is now warranted because we anticipate a significant slowdown in the pace of resale activity, new home construction and price gains in the coming year. Many properties have likely overshot their true value and will return to a pace of growth closer in line to the fundamentals.”
-
Another source of research on the relationship between house prices and household income is the 3rd Annual Demographia International Housing Affordability Survey: 2007. In it, the survey states that, “In recent decades, the Median Multiple has been remarkably similar among the nations surveyed, with median house prices generally being 3.0 or less times median household incomes where demand and supply are balanced.”
For Calgary, the median house price to household income ratio has been 2.8 as shown in the graph below:

In general, when house prices deviate too much above or below the longterm house price to household income ratio, house prices have tended to correct. Therefore, caution may be warranted if buying, as house prices are about 75% above what people could traditionally afford.
Terrain of Calgary Real Estate Valuation – Price To Rent Ratios January 16, 2008
Posted by DustinRJay in rental yields, valuation models.Tags: bonds, calgary house prices, Calgary real estate, price to rent ratios, valuation models
6 comments
In the previous post, I discussed how Calgary rental yields are less than many safe investments like bonds. I was interested in how the price to rent ratio compared in a historical perspective and what were the valuations like compared to previous real estate cycles.
A price to rent ratio is similar to the price to earnings concept which is borrowed from the equity markets. The idea is that house prices can be compared against the cash flow that can be generated from the property. Ergo, the higher the house price in comparison to the rent, the poorer the value of the asset.
RBC published a report in 2005 called “House Valuations Across Major Cities.” At the time of the report, it stated that price to earnings ratios for Calgary real estate had pushed “significantly beyond” late 1980’s levels.
The following is a graph of how price to rent ratios compare in Calgary. As you can see, rental yields are an underlying fundamental of house prices up until 1998, when house prices started increasing exponentially, but the trend for the rent index stayed at roughly the same as inflation.

The current valuations are roughly double the long term price to rent ratio. This information dovetails with my previous blog entry wherein I came up with a rental yield of 3.1% for Calgary house prices which is less than safe investments like bonds. A comparison against the long run price to rent ratio and the current valuations indicates that a more rational valuation would be 6.2% (slightly above low risk assets like bonds).
Therefore, caution may be warranted if buying, as house prices are roughly double traditional valuations.
Mind The Gap – Spreads Between Low Risk Investments and Calgary Rental Yields January 14, 2008
Posted by DustinRJay in rental yields.Tags: bonds, Calgary condos, Calgary real estate, rental yields
4 comments
I thought it would be interesting to compare Calgary rental yields against a suite of safer investments.
For one to invest in real estate, one should desire a higher rate of return than other safer investments.
So, how did Calgary real estate stack up against the safer investments? As you can see in the graph below, not very well… In general, Calgary rental yields were less than the safer investments yields like GIC’s, savings accounts and bonds. Low rental yields have led to high levels of condominium conversions as lessors arbitrage differences between renting and owning.

The following is a rental yield calculation for a two bedroom condo in Calgary:
December 2007 Calgary Condo Price = $304,719
Residential Tax Rate = 0.0054614
Annual Taxes = $1,664
2007 Calgary Two Bedroom Condo Rent =$1089/month
Condominium Fees = ~$150/month
Calgary Rental Yields = (1089*12-150*12-1664)/304719 = 3.15%
This compares against:
ICICI Bank Savings Account (4.25%)
ICICI Bank 1 Year GIC (4.65%)
GoC 2 Year Benchmark Bond Yield (4.25%)
GoC 3 Year Benchmark Bond Yield (4.00%)
GoC 5 Year Benchmark Bond Yield (3.75%)
GoC 7 Year Benchmark Bond Yield (5.00%)
GoC 10 Year Benchmark Bond Yield (4.00%)
GoC Long Benchmark Bond Yield (5.75%)
Rental yields would need to increase by roughly 75% in order to be competitive with other safer investments. Considering current market conditions, a fair market value of $175,000 instead of $304,719 may be warranted for a condo (a drop of ~$130,000).
I find it unlikely that Calgary rent will increase to make rental yields competitive so much as Calgary real estate prices will continue to drop due to:
- Calgary has the highest rent in the nation &
- For the first time since 1994, Alberta had negative interprovincial migration. This was likely due to individuals arbitraging regional cost of living differences.
Long Term Trends in Calgary Real Estate January 13, 2008
Posted by DustinRJay in long term real estate trends.Tags: Calgary real estate prices, Case-Shiller Index, Herengracht Index, long term real estate trends
45 comments
House prices have increased dramatically in the past few years. For people looking to buy Calgary real estate in the near future, it is worthwhile to examine whether or not the current valuations are justified and what is the upside potential or downside risks. If there is upside potential, how can one capitalize on it, and if there are downside risks how can one hedge against it?
From 1973 – 2007, house prices in Calgary have appreciated at 1.2%/year above inflation (not a hedonic regression). However, over the last 6 years house prices have nearly doubled.
This blog attempts to understand whether the increase has been substantiated by underlying rental yields, higher incomes, or lower carrying costs. In addition, this blog will examine value investing approaches to quantify Calgary house prices.
The following is a summary of the peaks, troughs and recovery times for previous real estate cycles in Calgary (graph is shown below):
-
Peak: 1981 – $234,000 (~21 years to recover)
-
Trough: 1984 – $125,000
-
Peak: 1990 – $192,000 (~8 years to recover)
-
Trough: 1995 – $159,000

Here are two interesting indexes to compare long term trends in Calgary real estate against:
-
Case Shiller Index – A History of Home Values – 1890 to 2006 & A History of Home Values – 1987 to 2007
The New York Times article states: “Between 1628 and 1973 (the period of Eichholtz’s original study), real property values on the Herengracht — adjusted for inflation — went up a mere 0.2 percent per year, worse than the stingiest bank savings account. As Shiller wrote in his analysis of the Herengracht index, “Real home prices did roughly double, but took nearly 350 years to do so.””
In summary, recent house appreciation in Calgary is much greater than the long term real estate trends. For long term trends, house appreciation of 1.2%/year for Calgary seems reasonable. Also, house prices tend to revert to mean. Caution may be warranted if buying, as house prices are approximately $150,000 more than the long term trend.


